Magnon Band Structure
For the theoretical background of magnon calculations, see Magnon Band Structure and Density of States: Theory.
TB2J provides a unified command-line tool TB2J_magnon.py for magnon band structure and DOS calculations.
New Interface (v0.9.12+)
Quick Start
# Plot magnon band structure
TB2J_magnon.py --bands

# Plot magnon DOS
TB2J_magnon.py --dos

# Plot both
TB2J_magnon.py --bands --dos

# Exclude specific interactions
TB2J_magnon.py --bands --no-Jani --no-DMI
Legacy Interface
There are also older scripts within the TB2J package for magnon calculations:
TB2J_magnon.py (Legacy)
This script can be used to plot magnon band structure from the Multibinit XML format:
TB2J_magnon.py --help

usage: TB2J_magnon.py [-h] [--fname FNAME] [--qpath QPATH]  [--figfname FIGFNAME] [--show]

TB2J_magnon: Plot magnon band structure from the TB2J magnetic interaction parameters

optional arguments:
  -h, --help     show this help message and exit
  --fname FNAME  exchange xml file name. default: exchange.xml
  --qpath QPATH  The names of special q-points. If not given, the path will be automatically chosen.
  --figfname FIGFNAME  The file name of the figure.
  --show         whether to show magnon band structure.
The input file (–fname) is by default exchange.xml, which can be found in the TB2J_results/Multibinit directory.
Example usage with BCC Fe:
TB2J_magnon.py --qpath GNPGHN --figfname magnon.png --show
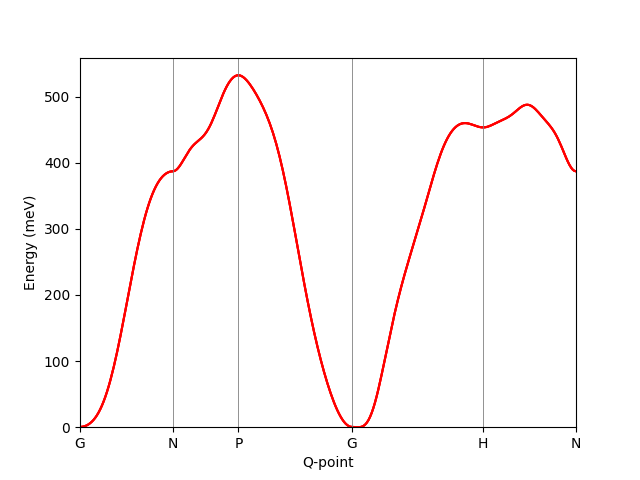
exchange_magnon
From version v0.7.5, the information for plotting the band structure is written into a json file (magnon_band.json), along with a script for parsing and plotting (plot_magnon_from_json_file.py).