Magnon band structure from TB2J output
In this section we show an application of calculating the magnon band structure using the TB2J results.
There is a script within the TB2J package: TB2J_magnon.py, which can be used to plot the magnon band structure. We can show its usage by:
TB2J_magnon.py --help

usage: TB2J_magnon.py [-h] [--fname FNAME] [--qpath QPATH]  [--figfname FIGFNAME] [--show]

TB2J_magnon: Plot magnon band structure from the TB2J magnetic interaction parameters

optional arguments:
  -h, --help     show this help message and exit
  --fname FNAME  exchange xml file name. default: exchange.xml
  --qpath QPATH  The names of special q-points. If not given, the path will be automatically choosen. See https://wiki.fysik.dtu.dk/ase/ase/dft/kpoints.html for the table of special kpoints and the default path.
  --figfname FIGFNAME  The file name of the figure. It should be e.g. png, pdf or other types of files which could be generated by matplotlib.
  --show         whether to show magnon band structure.
The input file specified to the –fname parameter is by default exchange.xml file, which is the output in the Multibinit xml format, as can be found in the TB2J_results/Multibinit directory.
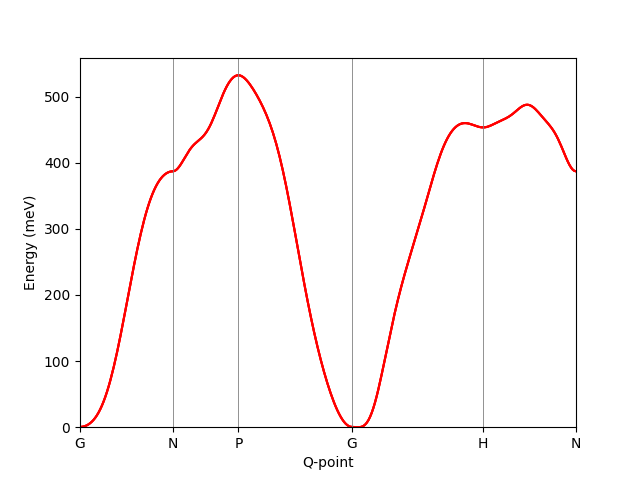
Here we take the BCC Fe as an example. After we have the TB2J_results directory, we can go to the Multibinit directory and find the exchange.xml file. The q-path can be generated automatically from the atomic structure information, using the [ASE][https://wiki.fysik.dtu.dk/ase/ase] library. We need to specify a path of q-points if the default is not what we want. The default k-path and the labels of the special kpoints can be found at this page. For example, we want a path of “Gamma-N-P-Gamma-H-N” instead of the default, it can be given by:
TB2J_magnon.py --qpath GNPGHN --figfname magnon.png --show
The magnon band structure is then written to a By using the –show parameter, the band structure is shown on screen.
exchange_magnon